Suricata
From https://suricata.io:
Suricata is a free and open source, mature, fast and robust network threat detection engine. Suricata inspects the network traffic using a powerful and extensive rules and signature language, and has powerful Lua scripting support for detection of complex threats.
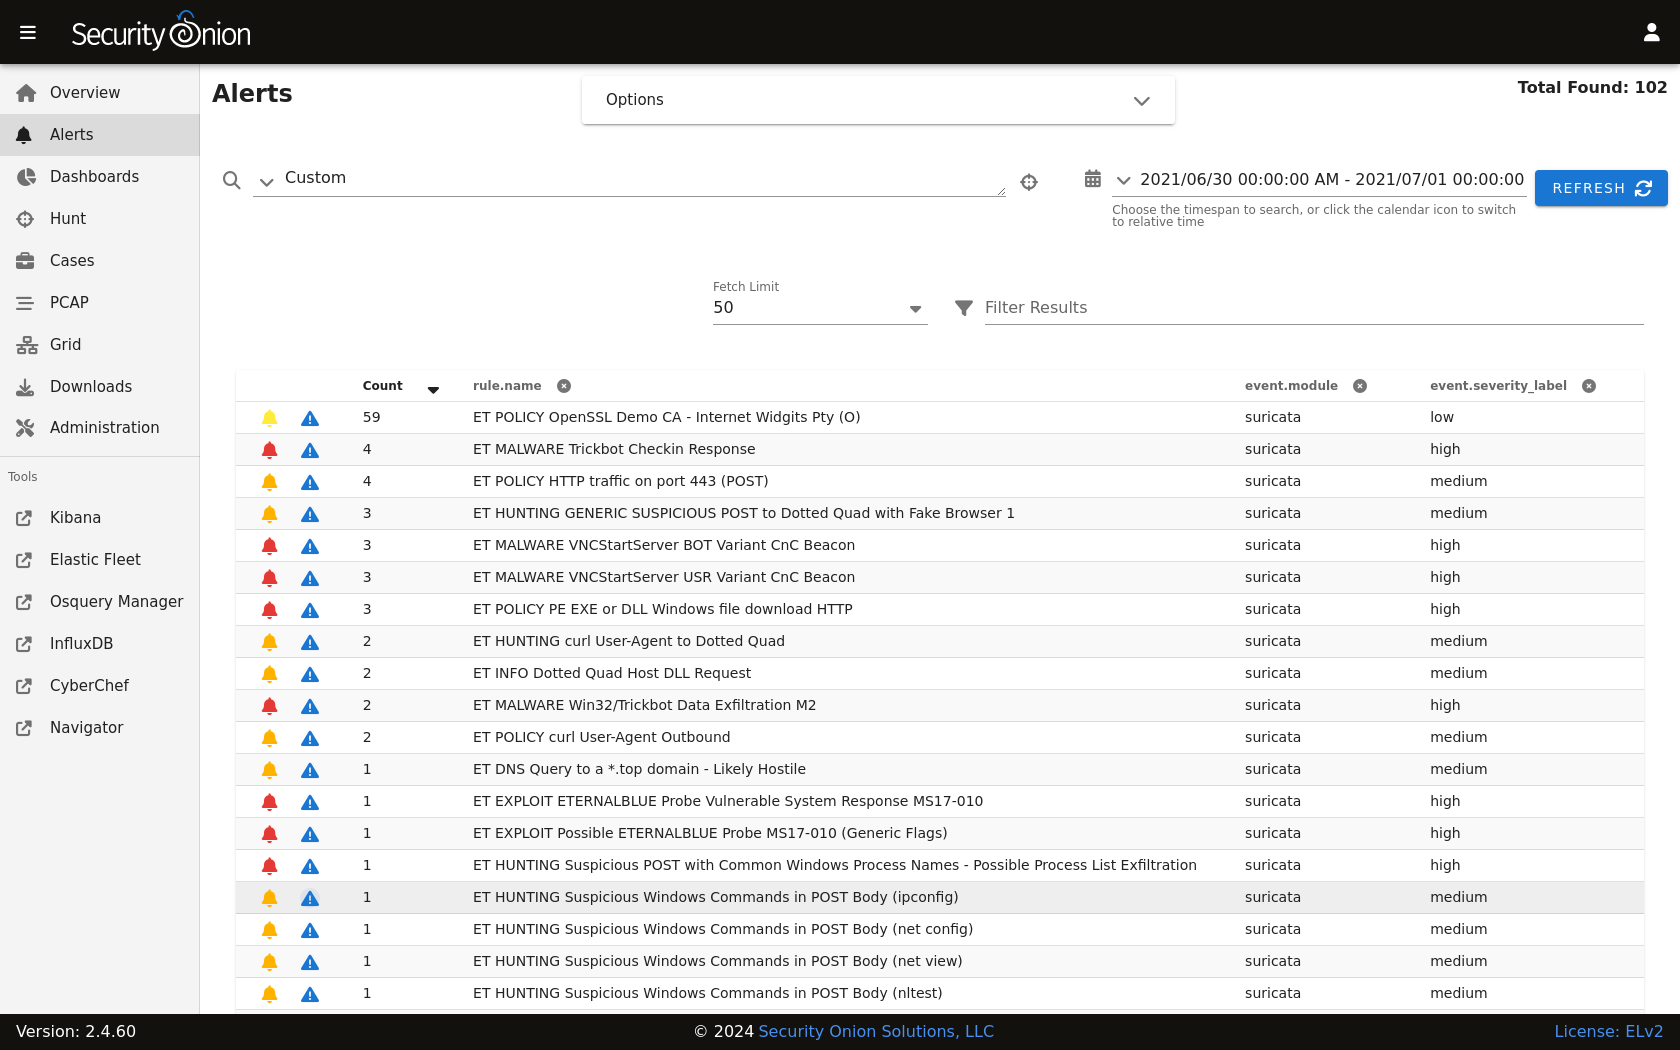
Suricata NIDS alerts can be found in Alerts, Dashboards, Hunt, and Kibana. Here’s an example of Suricata NIDS alerts in Alerts:
If enabled, Suricata metadata (protocol logs) can be found in Dashboards, Hunt, and Kibana.
Community ID
Security Onion enables Suricata’s built-in support for Community ID.
Configuration
You can configure Suricata by going to Administration –> Configuration –> suricata.
If you would like to configure/manage IDS rules, please see the Managing Rules and Managing Alerts sections.
HOME_NET
The HOME_NET variable defines the networks that are considered home networks (those networks that you are monitoring and defending). The default value is RFC1918 private address space (10.0.0.0/8, 192.168.0.0/16, and 172.16.0.0/12). You can modify this default value by going to Administration –> Configuration –> suricata –> config –> vars –> address-groups –> HOME_NET.
EXTERNAL_NET
By default, EXTERNAL_NET is set to any (which includes HOME_NET) to detect lateral movement inside your environment. You can modify this default value by going to Administration –> Configuration –> suricata –> config –> vars –> address-groups –> EXTERNAL_NET.
Performance
If Suricata is experiencing packet loss, then you may need to do one or more of the following: tune the ruleset (see the Managing Alerts section), apply a BPF, adjust max-pending-packets in the Suricata configuration, or adjust AF-PACKET workers in Administration –> Configuration –> suricata –> config –> af-packet –> threads.
Note
If you have multiple physical CPUs, you’ll most likely want to pin sniffing processes to a CPU in the same Non-Uniform Memory Access (NUMA) domain that your sniffing NIC is bound to. Accessing a CPU in the same NUMA domain is faster than across a NUMA domain.
Note
lscpu and lstopo, please see:Thresholding
To edit the thresholding configuration, please see the Managing Alerts section.
Metadata
By default, Security Onion uses Zeek to record protocol metadata. If you don’t need all of the protocol coverage that Zeek provides, then you can switch to Suricata metadata to save some CPU cycles. If you choose to do this, then here are some of the kinds of metadata you can expect to see in Dashboards or Hunt:
Connections
DHCP
DNS
Files
FTP
HTTP
SSL
If you later find that some of that metadata is unnecessary, you can filter out the unnecessary metadata by writing rules. We have included some examples at https://github.com/Security-Onion-Solutions/securityonion/blob/dev/salt/idstools/sorules/filters.rules.
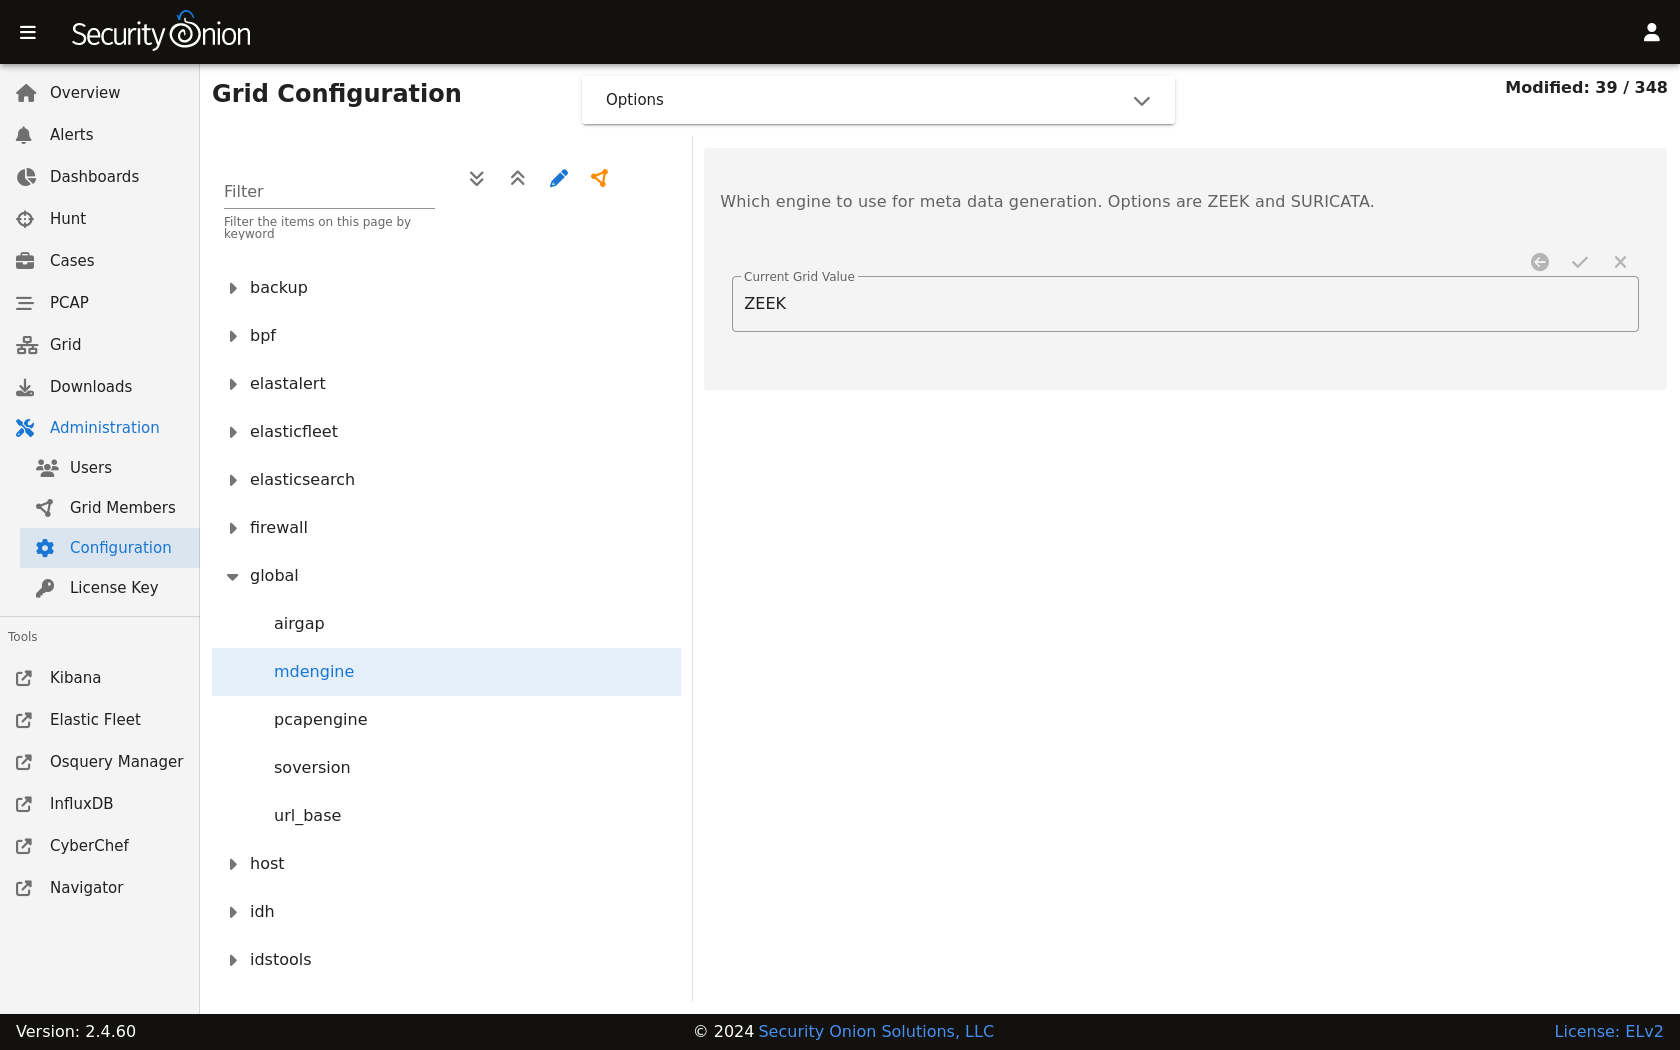
To change your grid’s metadata engine from Zeek to Suricata, go to Administration –> Configuration –> global –> mdengine and change the value from ZEEK to SURICATA:
File Extraction
If you choose Suricata for metadata, it will extract files from network traffic and Strelka will then analyze those extracted files. If you would like to extract additional file types, then you can add file types as shown at https://github.com/Security-Onion-Solutions/securityonion/blob/dev/salt/idstools/sorules/extraction.rules.
PCAP
Starting in Security Onion 2.4.60, you now have the option of switching full packet capture from Stenographer to Suricata.
Warning
This Suricata PCAP feature is in BETA! We recommend that you test this feature thoroughly in a test environment.
If you would like to experiment with Suricata PCAP, then you can go to Administration –> Configuration –> Global and select the pcapengine setting. That setting should default to STENO but you can change it to either TRANSITION or SURICATA. If you don’t need your old Stenographer PCAP at all, then you can immediately set pcapengine to SURICATA and manually delete the contents of the Stenographer PCAP and index directories. However, most folks will probably want to use the TRANSITION option as it will keep Stenographer running but not capturing traffic so that you can retrieve older Stenographer PCAP as well as new Suricata PCAP. Stenographer will then start purging its old PCAP as Suricata uses more space. Once your old Stenographer PCAP has fully aged off, you can change the pcapengine setting to SURICATA to fully disable Stenographer.
Differences between Suricata and Stenographer for PCAP
Stenographer indexes PCAP which allows instant retreival of PCAP sessions from disk. When a Suricata PCAP is requested, a process searches the PCAP files and retrieves the appropriate packets for the flow.
Since Stenographer indexes PCAP, it stores the PCAP in a special format. Suricata writes standard PCAP files which can be copied off to another system and then opened with any standard libpcap tool.
Suricata can compress PCAP using lz4 compression.
Suricata supports conditional PCAP if you only want to write PCAP when certain conditions are met.
Suricata has the ability to stop capturing PCAP once a flow reaches a specific stream depth. Security Onion sets this stream depth to 1MB by default. This means that once the PCAP flow reaches 1MB, Suricata will stop recording packets for that flow.
Currently, there is NO SUPPORT for a PCAP specific BPF for Suricata. If you apply a BPF to Suricata, it will apply to not only PCAP but also standard NIDS alerts and metadata if enabled.
Conditional PCAP
If you switch to Suricata PCAP, it will write all traffic to PCAP by default. If you would like to limit Suricata to only writing PCAP when certain conditions are met, you can go to Administration –> Configuration –> Suricata -> pcap -> conditional and change it to to either alerts or tag:
all: Capture all packets seen by Suricata (default).
alerts: Capture only packets associated with a NIDS alert.
tag: Capture packets based on a rule that is tagged.
PCAP Configuration Options
Here are some other PCAP configuration options that can be found at Administration –> Configuration –> Suricata -> pcap. Some settings are considered advanced settings so you will only see them if you enable the Show all configurable settings, including advanced settings. option.
compression: Set to
noneto disable compression. Set tolz4to enable lz4 compression but note that this requires more CPU cycles.lz4-level: Specify the level of lz4 compression.
0for no compression.16for maximum compression.maxsize: Max size in GB to use for PCAP stored on the sensor.
filesize: File size for the PCAP files that get written.
use-stream-depth: Set to
noto ignore the stream depth and capture the entire flow. Set this toyesto truncate the flow based on the stream depth.
Disabling
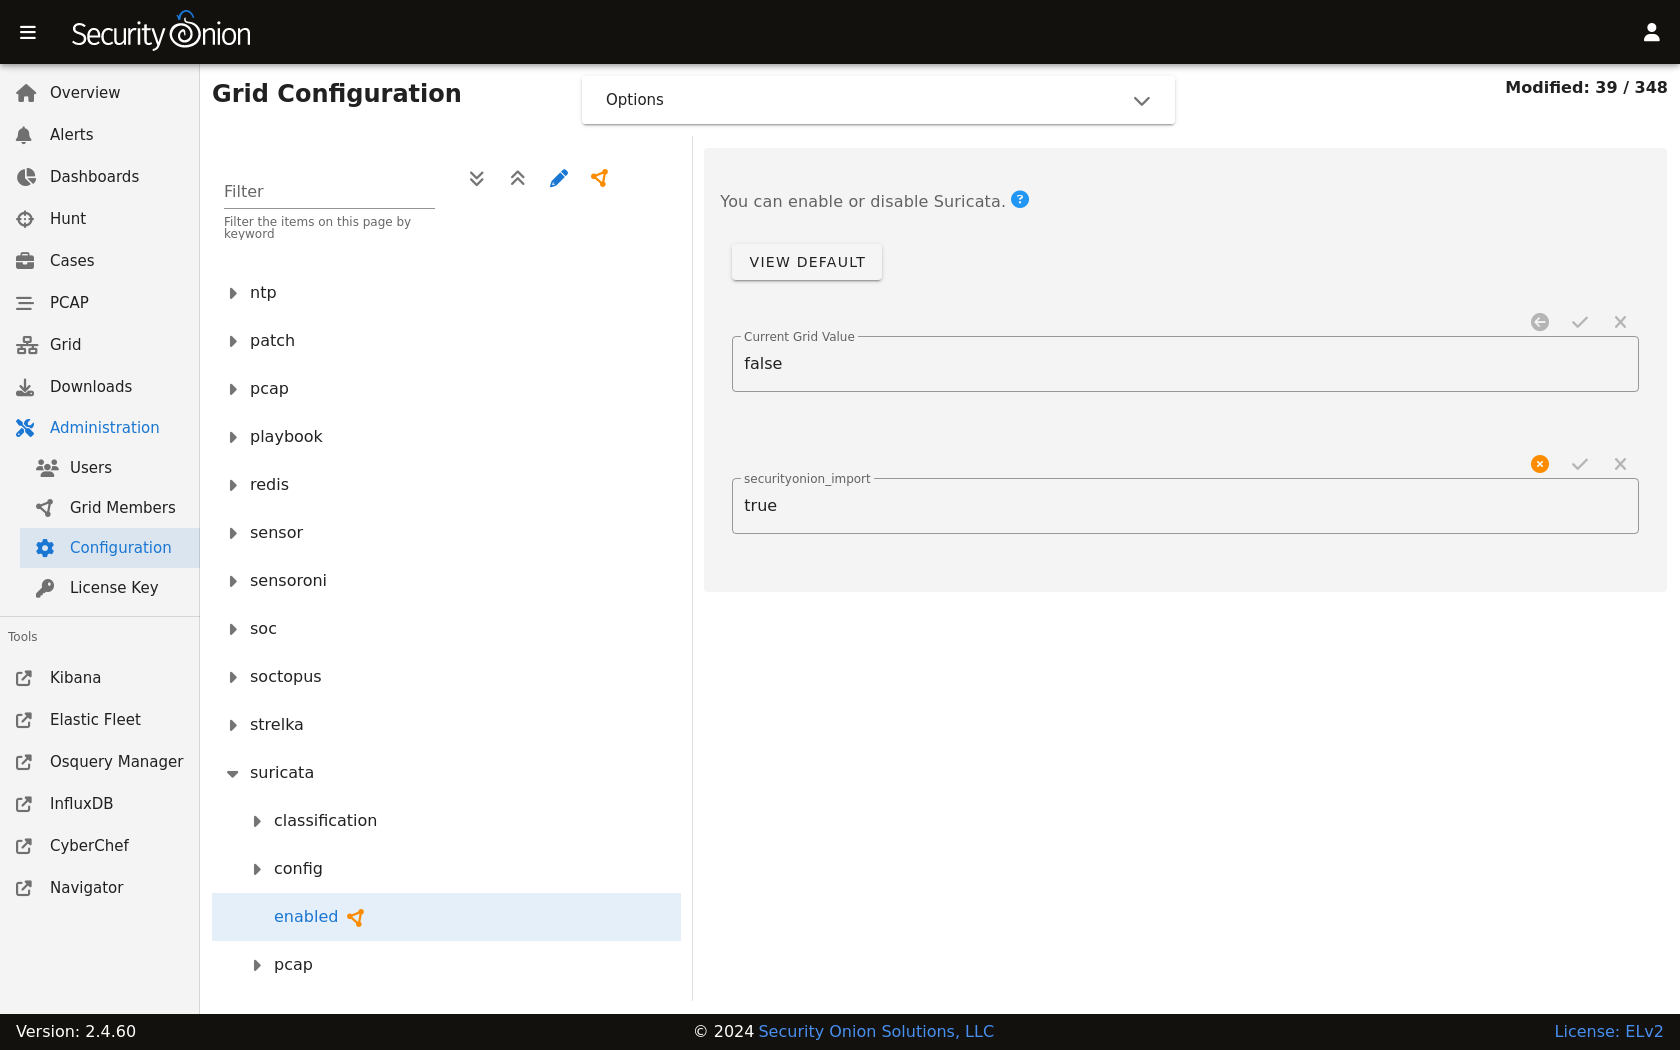
Suricata can be disabled by going to Administration –> Configuration –> suricata –> enabled.
Diagnostic Logging
If you need to troubleshoot Suricata, check /opt/so/log/suricata/suricata.log. Depending on what you’re looking for, you may also need to look at the Docker logs for the container:
sudo docker logs so-suricata
Troubleshooting Alerts
If you’re not seeing the Suricata alerts that you expect to see, here are some things that you can check:
If you have metadata enabled, check to see if you have metadata for the connections. Depending on your configuration, this could be Suricata metadata or Zeek metadata.
If you have metadata enabled but aren’t seeing any metadata, then something may be preventing the process from seeing the traffic. Check to see if you have any BPF configuration that may cause the process to ignore the traffic. If you’re sniffing traffic from the network, verify that the traffic is reaching the NIC using tcpdump. If importing a pcap file, verify that file contains the traffic you expect and that the Suricata process can read the file and any parent directories.
Check your HOME_NET configuration to make sure it includes the networks that you’re watching traffic for.
Check to see if you have a full NIDS ruleset with rules that should specifically alert on the traffic and that those rules are enabled.
Check to see if you have any threshold or suppression configuration that might be preventing alerts.
Check the Suricata log for additional clues.
Check the Elastic Agent, Logstash, and Elasticsearch logs for any pipeline issues that may be preventing the alerts from being written to Elasticsearch.
Try installing a simple import node (perhaps in a VM) following the steps in the First Time Users section and see if you get alerts there. If so, compare the working system to the non-working system and determine where the differences are.
Stats
For detailed Suricata statistics, check /opt/so/log/suricata/stats.log.
Testing Rules
To test a new rule, use the following utility on a node that runs Suricata (ie Forward or Import).
sudo so-suricata-testrule <Filename> /path/to/pcap/test.pcap
The file should contain the new rule that you would like to test. The pcap should contain network data that will trigger the rule.
More Information
Note
For more information about Suricata, please see https://suricata.io.